By Dom Luszczyszyn, Shayna Goldman and Sean Gentille
Editor’s Note: An earlier version of this article incorrectly projected the Sharks’ point total. That chart is updated to project 66 points instead of 68.
In the immediate aftermath of the Erik Karlsson trade, one thing was clear: The San Jose Sharks were going to be a baaaaaaaad hockey team in 2023-24.
Advertisement
That was already true with Karlsson in town — the team only earned 60 points last season despite his Norris-winning campaign — but without him things are as dire as can be. No team has less going for it this season than San Jose, so it should come as no surprise that the Sharks start the year projected to be the league’s worst team.
Let the rebuild truly begin.
The projection
Projected to be the worst doesn’t mean a last place finish is guaranteed. After almost a decade of running these projections you probably know that by now, but it’s always an important point to bold, highlight and underline.
For San Jose, a spot in the bottom 10 is a near guarantee at 97 percent and a bottom-five finish is almost a lock at 80 percent. But last place? That’s only a one-in-four chance. It’s a more decisive chance than the league’s best team has at winning the Stanley Cup — a testament to how dire the Sharks roster is — but it’s still more likely than not that the Sharks don’t finish last.
In hockey, there’s a wide range of outcomes that can happen, and surprise seasons are all too frequent. For a team this bad, the point of the designed roster is to minimize just how good that surprise can be (and maximize a “bad” season surprise). San Jose has done that to great effect here.
The only numbers that matter in a lost season for the Sharks are the numbers in the bottom right corner. The lower the Sharks finish, the stronger their future outlook becomes. No team is in a better position to finish as low as possible than San Jose.
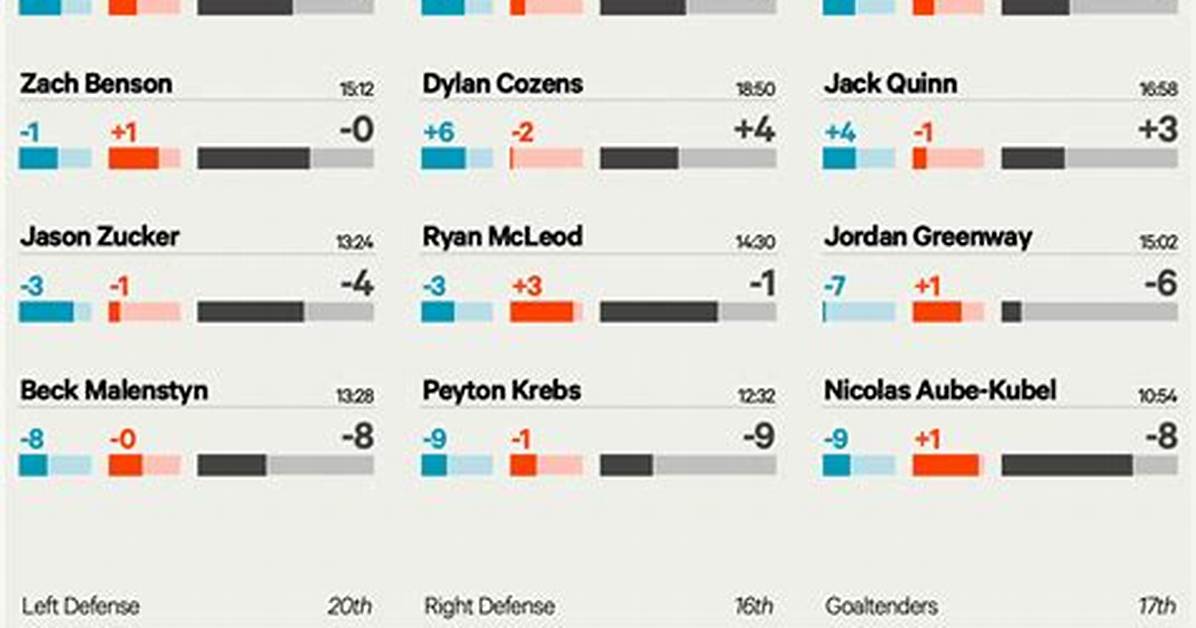
Percentiles with the bar graphs are based on each player’s Offensive, Defensive and Net Rating relative to their time-on-ice slot, i.e. the first forward is compared to other first forwards only.

